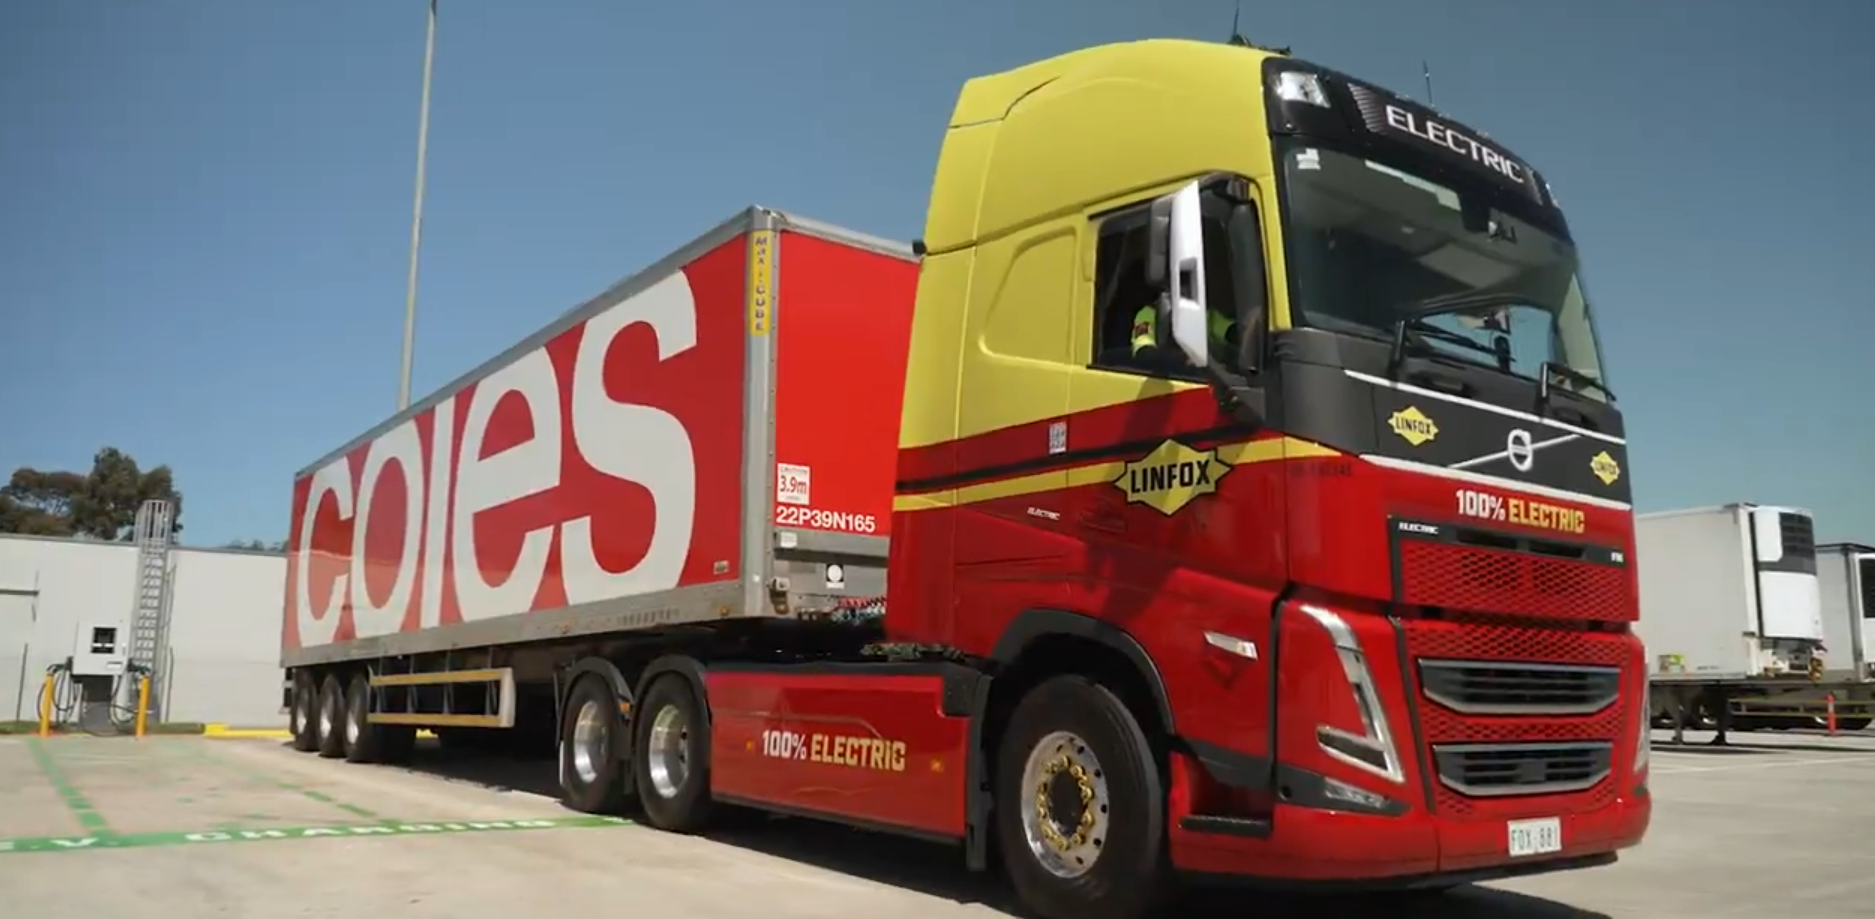
The question isn’t whether electric trucks cost less to run than diesel ones. At current fuel and maintenance cost differentials, they do — by a significant margin. The question is whether the total cost of electrification, including vehicles and charging infrastructure, produces a net positive return over a realistic planning horizon, and what that return actually looks like for your specific fleet.
This article works through the ROI analysis for electric truck fleet electrification in an Australian context. It covers the OPEX savings that drive the financial case, the infrastructure costs that are most often underestimated, the grant programs that can meaningfully change the numbers, and a five-year payback model that fleet managers can adapt to their own operations.
The analysis draws on EVSE’s involvement in fleet electrification projects including Toll Group’s Project TruckVolt — the largest corporate investment in heavy electric vehicles in Australian history — and CJD Equipment’s charging infrastructure deployment.
The OPEX Case: Where the Savings Actually Come From
Electric trucks carry two primary OPEX advantages over diesel: energy cost and maintenance cost. Both are substantial. Neither is fully captured in simplified comparisons.
Energy Cost Savings
Diesel for a heavy rigid truck running typical metropolitan distribution routes currently costs approximately $0.21 to $0.25 per kilometre in fuel alone, based on national average diesel prices and typical fuel efficiency for vehicles in this class.
The equivalent electricity cost for an electric vehicle in the same class, charged at a commercial off-peak tariff, runs to approximately $0.06 to $0.10 per kilometre — depending on the electricity tariff, the vehicle’s energy consumption per kilometre, and how much of the charging is done during off-peak periods.
The spread between those figures — $0.11 to $0.19 per kilometre — is the energy saving. For a vehicle covering 100,000 kilometres per year, that’s $11,000 to $19,000 in annual fuel savings per vehicle, before any other consideration.
| Diesel cost per km (heavy rigid, metro) |
$0.21 — $0.25 |
| EV charging cost per km (off-peak commercial) |
$0.06 — $0.10 |
| Annual energy saving (100,000km) |
$11,000 — $19,000 per vehicle |
| Fleet of 20 vehicles (annual saving) |
$220,000 — $380,000 |
Maintenance Cost Savings
The maintenance cost differential between electric and diesel heavy vehicles is less commonly discussed but similarly significant. Diesel engines have hundreds of moving parts — pistons, crankshafts, camshafts, timing systems, fuel injection components, exhaust systems including DPF filters and AdBlue dosing. Each is a potential failure point and a maintenance cost.
Electric drivetrains are mechanically simpler. No engine oil, no transmission fluid, no exhaust aftertreatment, no fuel filters, no timing belts. The primary wear items are tyres, brake pads (less frequently replaced due to regenerative braking), and eventually the battery.
Industry data and EVSE’s project experience suggest that maintenance costs for electric heavy vehicles run 20 to 40 percent lower than equivalent diesel vehicles over a five-year period. For a fleet averaging $25,000 per vehicle per year in maintenance spend, that’s a saving of $5,000 to $10,000 per vehicle annually.
| Typical annual maintenance (diesel heavy rigid) |
$20,000 — $30,000 per vehicle |
| Estimated annual maintenance (electric equivalent) |
$12,000 — $21,000 per vehicle |
| Annual maintenance saving per vehicle |
$5,000 — $10,000 |
| Fleet of 20 vehicles (annual saving) |
$100,000 — $200,000 |
Combined, the energy and maintenance savings for a fleet of twenty electric heavy vehicles can reach $320,000 to $580,000 per year. That’s a meaningful annual cash flow improvement even before considering revenue-side benefits or grant income.
Infrastructure Costs: The Figures Most Models Get Wrong
The financial models that struggle to build a compelling case for heavy vehicle electrification are almost always the ones that underestimate infrastructure costs. The vehicle-versus-vehicle comparison is straightforward. The infrastructure comparison requires more work.
What a Serious Heavy Vehicle Charging Installation Costs
A twenty-vehicle electric heavy rigid fleet requires between ten and twenty chargers at a single depot, assuming overnight charging windows and active load management to share capacity. The hardware for this — commercial AC chargers in the 22kW range for standard overnight charging, potentially DC fast chargers for mid-shift top-up requirements — is a relatively small part of the budget.
The larger costs are in the infrastructure behind the chargers.
| Charger hardware (AC, 22kW, per unit) |
$2,500 — $6,000 |
| Charger hardware (DC, 60–120kW, per unit) |
$20,000 — $45,000 |
| Site electrical infrastructure (civil, cable, switchboard upgrade) |
$80,000 — $350,000 |
| DNSP connection upgrade (if required) |
$30,000 — $400,000+ |
| Load management software (annual) |
$15,000 — $40,000 for fleet of 20 |
| Substation (if required) |
$500,000 — $2,000,000+ |
The wide ranges in that table reflect the reality that infrastructure costs are site-specific. A depot with a recently upgraded switchboard and a DNSP connection that can accommodate the additional load has very different infrastructure costs from an older site that needs both a switchboard replacement and a network augmentation.
This is why the site assessment comes first. Without it, infrastructure costs are guesses. With it, they’re known quantities that can be modelled accurately.
The Vehicle Premium
Electric heavy vehicles currently carry a purchase price premium over diesel equivalents. The quantum of that premium varies significantly by vehicle class and configuration, but for heavy rigid trucks in the Australian market, the premium is broadly in the range of 50 to 100 percent of the diesel vehicle price.
Toll Group’s TruckVolt project deployed Volvo FE and FM prime movers — vehicles at the higher end of the cost range, reflecting current manufacturing volumes and the technology’s maturity. As production volumes increase and battery costs continue to fall, this premium is expected to compress materially over the next five years.
Fleet electrification decisions made today are made in the context of current vehicle prices. But the five-year financial model should account for the likelihood that replacement vehicles at contract end will cost significantly less, improving the long-term ROI picture.
Grant Programs: The Lever That Changes the Model
For Australian fleet operators, government grant programs are the most powerful available lever on the capital cost side of the ROI equation. The programs available vary by state, vehicle type, and application timing — but for eligible projects, they can materially change the payback calculation.
Federal Programs
ARENA (the Australian Renewable Energy Agency) has been the primary federal funding body for large-scale fleet electrification. Toll Group’s TruckVolt project secured ARENA support as part of its $67 million investment. ARENA’s programs are competitive and application-intensive, but for large fleet projects they offer the most significant available funding.
The National Electric Vehicle Strategy, released in 2023, signals continued federal commitment to supporting fleet electrification. Current and upcoming programs should be verified directly at arena.gov.au — program terms change and the most current information is on the agency’s website, not in published guides.
State Programs
State-level programs vary considerably. NSW, Victoria, and Queensland have all offered fleet electrification support through various energy and transport agencies. Western Australia’s programs have focused on public transport but include components applicable to private fleet operators.
State programs are often faster to access than federal ARENA grants, with simpler application processes and shorter decision timelines. They’re also more likely to cover charging infrastructure specifically, rather than vehicle acquisition alone.
Grant-Adjusted ROI
The table below shows how grant funding affects the payback calculation for a twenty-vehicle heavy rigid fleet, using mid-range assumptions.
| Total project cost (vehicles + infrastructure, no grant) |
$4.8M — $7.2M (illustrative) |
| Total project cost (with 30% grant on infrastructure) |
$4.5M — $6.8M (illustrative) |
| Annual OPEX savings (energy + maintenance) |
$420,000 — $780,000 |
| Payback period (no grant) |
6 — 17 years (wide range due to site variability) |
| Payback period (30% infrastructure grant) |
5.5 — 15 years |
| 5-year cumulative saving (operating costs only) |
$2.1M — $3.9M |
The range in payback periods reflects the genuine variability in infrastructure costs. Projects with straightforward site conditions and existing network capacity at the lower end of that range. Projects requiring substation construction at the upper end. This is why infrastructure cost clarity — through a proper site assessment — is the most important input to a reliable ROI model.
Building the Internal Business Case
ROI models for fleet electrification tend to fail internally not because the numbers are wrong but because they’re presented in the wrong frame. A CFO reviewing a $5 million capital proposal needs a different level of confidence in the assumptions than a fleet manager evaluating a ten-charger installation.
The Variables That Matter Most
The sensitivity of the payback calculation to individual assumptions is not uniform. Two variables dominate:
- Infrastructure cost: the range between optimistic and pessimistic infrastructure scenarios is often larger than the total vehicle cost difference between electric and diesel. Site assessment eliminates this uncertainty.
- Utilisation and km travelled: the annual savings are a direct function of how much each vehicle is driven. A truck covering 80,000km/year generates a different saving from one covering 130,000km/year. Use your actual fleet data.
Electricity tariff assumptions are also important but more manageable — smart charging with time-of-use tariff optimisation can shift a material proportion of charging to off-peak periods, and this should be modelled explicitly rather than using a blended average tariff.
What to Present to the Board
A board-ready business case for heavy vehicle electrification should include three scenario models: a conservative case (higher infrastructure costs, lower km, current fuel price), a base case (site-assessed infrastructure costs, current fleet utilisation, modest fuel price increases), and an optimistic case (grant funding secured, higher km utilisation, fuel price escalation).
Presenting the range — rather than a single point estimate — is more credible and more useful. It shows the board the conditions under which the investment pays off and the conditions under which it doesn’t, which is exactly the information they need to make a considered decision.
A note on vehicle lifecycle timing: Most heavy vehicle fleets replace vehicles on seven to ten-year cycles. Electrification decisions made at the natural replacement point — rather than as early replacements — have better financial profiles because they avoid the cost of removing an asset mid-life. Mapping the electrification plan onto the existing replacement schedule is a straightforward way to improve the economics without changing a single assumption.
What CJD Equipment’s Project Demonstrates
EVSE’s charging infrastructure deployment for CJD Equipment — a major equipment dealer with significant fleet requirements — illustrates a commercial application of these principles outside the logistics sector. CJD’s fleet mix and operational patterns created specific load management requirements that differed from a standard depot configuration, requiring custom ALM configuration to match charging schedules with the variable dwell times of commercial equipment.
The project reinforced a consistent theme from large-scale fleet electrification: the infrastructure that works is the infrastructure designed around the actual operational patterns of the fleet, not a generic specification applied uniformly. The data on how vehicles are actually used — kilometres, dwell times, departure windows, charging opportunity windows — drives every significant decision in the infrastructure design.
That data exists in every fleet management system. Using it properly is the difference between a five-year payback and an eight-year one.
Heavy vehicle electrification in Australia is past the proof-of-concept stage. TruckVolt demonstrated that at scale. The financial model is sound for a wide range of fleet configurations. What determines whether it’s sound for a specific fleet is whether the infrastructure costs are known — through proper site assessment — and whether the operational savings are modelled against actual fleet data rather than industry averages. Both of those things are available before any commitment is made.
-
Job Title - Co-Founder, EVSE Australia
11 years of EV charging deployment history
EV specialist, ev driver, member of AFMA, AEVA, EV Council, HVIA
Sam Korkees is the Co-Founder of EVSE Australia, a leading provider of electric vehicle (EV) charging infrastructure and solutions. Since co-founding the company in 2014 alongside Brendan Wheeler, Sam has played a pivotal role in scaling EVSE from an early-stage startup into a nationally recognised leader in EV charging.
EVSE has delivered some of the country's largest EV fleet and depot charging deployments, supporting the electrification of commercial fleets, logistics operations, and government assets. The company is also recognised as a leader in public charging infrastructure, with extensive experience in the rollout of fast and ultra-fast DC charging networks nationwide.
Sam works closely with government, utilities, and enterprise clients to design and implement scalable, future-ready charging solutions, helping accelerate the adoption of EVs across Australia.
Credentials: 11 years of EV charging deployment history, EV specialist, EV driver, member of AFMA, AEVA, EV Council, HVIA